
Marketplaces have revolutionised the way we discover and purchase goods and services. From digital products to home services, there are 4 types of online marketplaces and their business models (B2B, B2C, and C2C) and have become a dominant force in the economy.
However, managing a successful marketplace is no easy feat. When it comes to measuring the success of your online marketplace, there are 10 top-level KPIs that you should be tracking.
I prefer referring to them KPI Clusters since each includes several KPIs and in this article I’ll highlight the most crucial for your marketplace.
Scale
Scale is an essential KPI for any online marketplace business, and Gross Merchandise Value (GMV) is the best way to measure it.
GMV measures the total value of all the products sold on your marketplace, including taxes and fees. It’s a crucial KPI for understanding the revenue growth and profitability of your marketplace. By tracking GMV, you can identify the top-performing product categories and optimise your product mix to boost sales and profitability.
Caveating services marketplaces where it’s a good idea to differentiate between “contracted” and “delivered” GMV figures since there can be a significant delay between the two.
Also, don’t forget to calculate GMV post-cancellations and returns to get an accurate view of performed transactions.
Another crucial metric for measuring scale is Net Revenue, which represents the actual revenue that accrues to your marketplace driven by the “take rate.” The take rate is the commission taken for each transaction, typically ranging from 10% to 30%.
Margin
Margin is measured by subtracting the cost of goods sold (COGS) from net revenues to get the Gross Margin (GM).
A more revealing measurement of the “true” take rate is the Contribution Margin 1, which is further derived by subtracting any other variable costs from GM, such as payment costs, customer service, onboarding, data, etc.
Subtract any sales and marketing costs from this metric to get the Contribution Margin 2, or how much money you actually make after variable and acquisition costs. Ensure that you include seller acquisition costs in your Contribution Margin because you need both sides of the marketplace to scale.
Many marketplaces have attractive gross margins but unattractive – and even negative – contribution margins, pointing to expensive customer acquisition, inefficient or manual processes, or a lack of operational leverage.
Momentum
Momentum is a critical KPI that measures the growth of your marketplace business. Growth is always good, but ensure that it’s accompanied by attractive contribution margins and unit economics to be economically sustainable in the long run.
Be mindful of accumulating undue amounts of “operational debt” and set in place operational processes to allow for the current pace of growth to continue smoothly in the future.
Also, take into account seasonality of certain verticals, such as real estate, mobility and travel, entertainment or recruiting, which experience strong variation in business throughout the year.
In such scenarios, YoY figures would be more accurate than MoM figures to gauge actual growth.
Another essential metric to track for momentum is market share. As you gain dominance, it’s critical to monitor your relative position in the market. You should calculate market share by looking at both traditional incumbents and newcomer marketplaces.
Activity
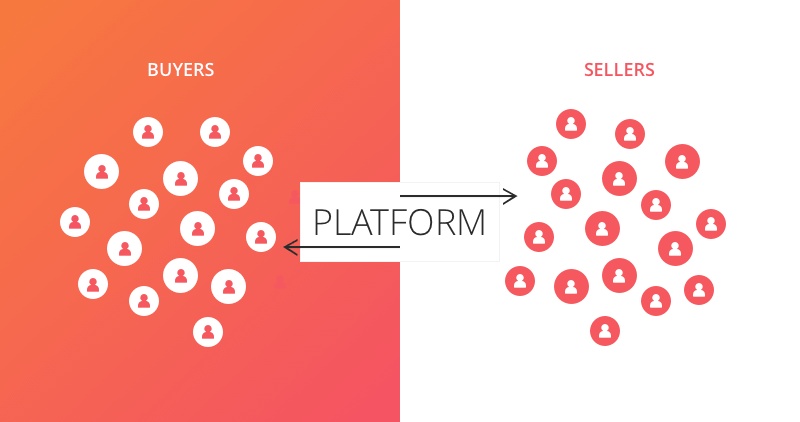
Activity or marketplace liquidity is crucial to the success of a marketplace. It is essential to ensure that buyers and sellers transact with each other frequently.
One way to measure activity in the marketplace is by tracking the percentage of items or services booked / sold within a specified time.
The higher the percentage and the shorter the time frame, the more sellers are making money, and buyers are becoming loyal customers.
The average order value (AOV) is another essential metric for understanding the customer demographic and their spending habits, as well as a key indicator of how much the marketplace earns from each customer with every order. Channel mix will heavily vary based on AOV.
AOV measures the average value of each purchase made on your marketplace.
Increasing your AOV can lead to higher revenue and profitability without needing to rely on new customer acquisition. You can achieve this by offering product bundles or creating upsell opportunities during the checkout process.
The number of items per basket is a significant driver of AOV, indicating the platform’s ability to induce cross-selling.
Engagement
In some high-AOV or freemium marketplaces, transactions may not occur immediately, and messages between suppliers and buyers can drive engagement on the platform.
Frequent communication also creates a platform lock-in for both sides of the marketplace. For instance, if the platform becomes a user’s central hub to manage communication with potential suppliers, it has a higher chance of retaining and monetising that user later on.
Net promoter score (NPS) and user reviews are critical in determining whether customers are delighted with the experience, intend to generate repeat orders, and will act as advocates for the platform, recommending it to future customers.
NPS measures customer satisfaction and loyalty by asking customers how likely they are to recommend your business to others. It’s a valuable KPI for understanding customer sentiment and improving customer experience. By improving your NPS, you can increase customer retention and attract new customers through positive word-of-mouth.
Supplier Reviews are also important, but they may not always be readily available.
Retention
User cohorts showcase the continued activity of a set of customers acquired in a specific period. Monthly cohorts typically strike a balance between information / noise ratio and ease of generation.
Metrics such as revenues, gross / contribution margin, or the number of orders can be used to run cohorts.
For most marketplaces it is highly advisable to run cohorts across both buyers and sellers to avoid a bottleneck in growth.
Repeat orders are computed most accurately by running weighted averages on historical cohorts rather than simple averages.
This approach helps to reveal true repeat patterns. Cohort consistency helps to understand buyers and sellers better, determining whether repeat orders are always generated by the same power buyers/sellers.
Churn rate is another KPI that supports retention by measuring the percentage of customers who have become inactive over a given period. A high churn rate indicates that your customer experience may need looking at, or your product mix needs to be optimised. Reducing churn can lead to increased customer loyalty, retention, and long-term revenue growth. Since lowering churn indicates improving customer satisfaction and product / brand love, it also supports building your brand.
Not necessarily retention metrics but Customer Support Metrics and Seller Support Metrics can help indirectly influence retention.
Customer support metrics
This is a suite of metrics on the demand-side measuring the quality and effectiveness of your customer support team, including response time, resolution rate, and customer satisfaction. Optimising your customer support can increase customer loyalty and retention, leading to long-term revenue growth.
Seller metrics
On the Supply-side, the suite of seller metrics measure the performance of your sellers, including sales volume, product quality, and customer satisfaction. Monitoring seller metrics can ensure a high-level of quality on your marketplace and attract more sellers to your platform. By providing the support and resources that your sellers need to succeed, you can build a thriving online marketplace that benefits everyone involved.
Concentration
Whale curves highlight the concentration of users on the demand or supply side.
These curves represent the plots of the number of customers vs. the percentage of business generated over a period. It is essential to diversify the supplier base in the future, as a small number of top suppliers could drive most of the sales.
The 80/20 rule often applies, where 80% of the activity is generated by 20% of buyers or sellers.
Sector, geographic, and product concentration are other important aspects to consider. While concentration can be positive, it can also be negative if the areas generating the bulk of the business have limited potential.
Fragmentation is another aspect to consider, as it can help determine if a marketplace is a few-to-many or a many-to-many platform.
Acquisition
Without acquisition any business would not be trading and online marketplaces are no different.
The key metrics to track are customer acquisition cost (CAC) and cost per acquisition (CPA) and conversion rate (CVR).
The cost of acquiring new customers is critical and by tracking your CAC, you can understand the cost of acquiring new customers through any of your marketing channels, such as paid and organic channels, spanning performance and brand activities.
Optimise your marketing budget and identify which channels bring the most qualified leads.
A high CAC indicates that your marketing efforts need to be optimised to attract more qualified leads at a lower cost.
In this context it’s crucial to understand all funnel conversion stages and compute CPAs for both the supply and demand side.
That’s where CVR comes in.
A high conversion rate indicates that your marketing and product strategies are synced and work effectively. Conversely, a low conversion rate may reveal touchpoint frictions in the user journey that need optimising.
Frictions might be down to your content, targeting or UX. Dive into your data and utilise tactical growth experimentations to help identify and reduce frictions from the user journey.
Channel scalability and mix are also crucial aspects to consider, as it helps determine which channels will be the best investment options while maintaining a reasonable CPA and the quality of acquired customers.
Return on Advertising Spend (ROAS) is your KPI for measuring revenue generated from ad campaigns compared to the cost of running those campaigns. It’s a crucial KPI for measuring and piloting the effectiveness of your advertising efforts.
By optimising your ROAS, you can maximise your advertising investment and increase revenue.
ROI (Return on investment)
Consider Return on investment (ROI) when measuring marketplace performance. Customer Lifetime value (LTV or CLV, as it’s also referred to) indicates the economic value a buyer or supplier can generate over their lifetime on your platform.
By understanding LTV, you can identify the most valuable customers and segment them based on their behaviour and preferences.
LTV:CAC ratio indicates whether or not you’re generating a strong ROI with your customer acquisition. Conversely, a low ratio may suggest re-evaluating marketing and sales strategies.
Cash
Cash refers to the amount of money your marketplace has available for operating expenses. This KPI takes into account factors such as burn rate, fundraising needs, and contribution margins.
By monitoring cash flow, you can ensure that your business is financially stable and that you have the resources you need to grow your marketplace.