


Home » Scaling Up: Driving Sustainable Growth by Mastering Key Growth Metrics
 Written by
Cornel Lazar
Written by
Cornel Lazar To achieve growth, it’s crucial to appreciate that growth is a journey, not just a destination. To move forward effectively, organisations must adopt a growth mindset rooted in data to make informed decisions and learn tactically along the way for continuous calibration and optimisation. For that, you need focusing on the most insightful growth metrics.
Measure what matters is not only the title of John Doerr’s ultimate book on OKRs, but also key to growth. Identifying and monitoring the correct key growth metrics and KPIs is crucial.
Let’s explore some of these Growth metrics and why measuring them is important.
CAC examines the total expenses for marketing and sales required to acquire a new customer within a defined timeframe (e.g., month, quarter, year). In this context, a customer refers to a new user who has made a purchase.
Your LTV indicates the expected revenue over the average lifespan of a single customer. Calculating LTV varies depending on your business, but a good starting point would be:
PQL and the PQL-to-Paid CVR are particularly relevant to product-led-growth (PLG) companies. A PQL represents a user who has experienced value from using a product, often through a trial or freemium model, limited feature access, or other firsthand experiences.
If you are a PLG company or considering transitioning to one, tracking and optimising these metrics is essential. Calculate your PQL-to-Paid conversion rate:
Understanding your website traffic is highly important. If your traffic remains steady or increases, but your traffic-to-lead ratio is low or decreasing, it’s a clear sign that something on your page needs optimisation or addition. This could range from your messaging to user experience or the implementation and review of your lead magnet.
The formula is essentially the visits to MQL (leads) conversation rate.
This metric reveals how many leads the sales team successfully converts into customers. However, driving SQL performance is not exclusive to the Sales Team. Growth teams want to get a full-funnel view and conduct a cohort analysis. Are you targeting and acquiring the best leads? Does the lead scoring system need calibrating? Calculate both your sales qualified lead (SQL) conversion rate and sales accepted lead (SAL) conversion rate.
Every time a user progresses from one touchpoint to the next, it counts as a conversion. The general use of CVR as a primary metric is in the context of landing page conversions, where it measures how many users or leads at the bottom of the funnel make a purchase through the website or app.
This metric represents the percentage of users who didn’t renew paying for a product within a specific time period.
It indicates the average amount a customer spends per order on your product or website. To calculate Average Order Value (AOV), divide the total revenue by the number of orders.
This percentage reflects the number of users continuing using the product and measured after a specific date.
Users renewing a subscription and continue using your product. Measured in percentage and from the end of their subscription period.
A Customer Health Score determines whether customers are happy using the product or service or at-risk of lapsing or churning. The scoring system will greatly vary from company to company but it always combines multiple indicators, such as usage, satisfaction, and support interactions.
How fast are your users adopting your product or specific features? The Product Adoption Rate is a cross-functional metric but generally owned by Product Marketing as part of a GTM strategy. Measured as a percentage within a timeframe following its release.
The LTV:CAC Ratio is one of your most important metrics. It tells you how much you spend per customer and how much money you make from each customer.
The LTV:CAC ratio is calculated by dividing your LTV by CAC. LTV:CAC is a signal of profitability. Rule of thumb is to aim for a LTV:CAC ratio of 3x or higher before considering to scale. 3:1 or above. This means, for every £1 spend on acquiring a new customer, you are making £3 or more.
Crucial caveat: Pre-PMF startups should not optimise to LTV:CAC and instead focus on getting your product in front of customers and get feedback.

Marketing leader at the intersection of Growth and Brand, driving innovation, scale, and positive transformation.
I enjoy partnering with ambitious organisations that want to change the game – redesigning your marketing functions, reshaping your growth strategies, and reimagining how your products scale and customers connect in a digital-first world.
My approach to change aligns people with optimised processes and the right tools to execute strategies and build functions anchored on data, creativity and innovative tech to unlock growth across the AARRR spectrum for user & brand excellence.
Reforge and Google Squared-Online alumni.
I graduated the Digital Business Leadership program in the top 10% of my cohort with distinction as Inspirational thought leader and nomination as Digital Champion amongst 180+ peers.
COHORT FEEDBACK
“Awesome, awesome dude to work with. Couldn’t have asked for a better team-mate! Well done.” – Ryan Roberts
“Saved us a few times!!!” – Mehdi Ramzi
“Well deserved!” – Kasia Wisniewska


My Equity Offer Calculator can help you understand the true value of company shares and equity packages you may be offered during a job interview process. Learn key questions to ask so you can decide with confidence whether that offer holds value for you.

Use my free step-by-step ChatGPT prompts generator for achieving high-quality content marketing copy and supporting SEO. Streamline your creative processes with AI now. You will also get access to the Custom GPT.


Discover how big data is transforming CRM and why CMOs are teaming up with data analysts to make data-driven decisions in the age of customer experience.
Learn how to create a consistent and compelling tone of voice for your brand. Forge emotional connections, stand out and differentiate from competitors.
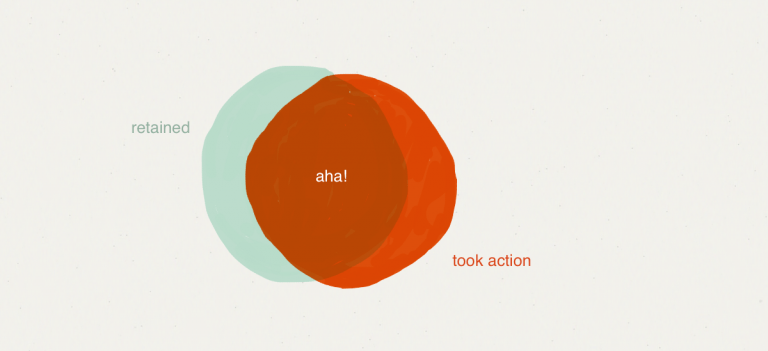
Many businesses focus solely on acquiring new customers rather than keeping existing ones. This article explores how focusing on activation during onboarding can solve retention issues.
Learn about customer-led buying models and how they can help increase demo requests. Drive SaaS growth by giving your Leads greater control and a positive experience while keeping a human…
Discover how Airbnb’s use of design thinking turned their business around, taking them from a failing startup to a billion-dollar success story.