Product-led growth or PLG as it has become known, is a strategic approach for delivering value through your product to drive user acquisition, retention, and expansion.
In this article, I will explore the concept of product-led growth, how to model and visualise Monthly Recurring Revenue (MRR) as a key metric to measure and drive PLG.
TL;DR
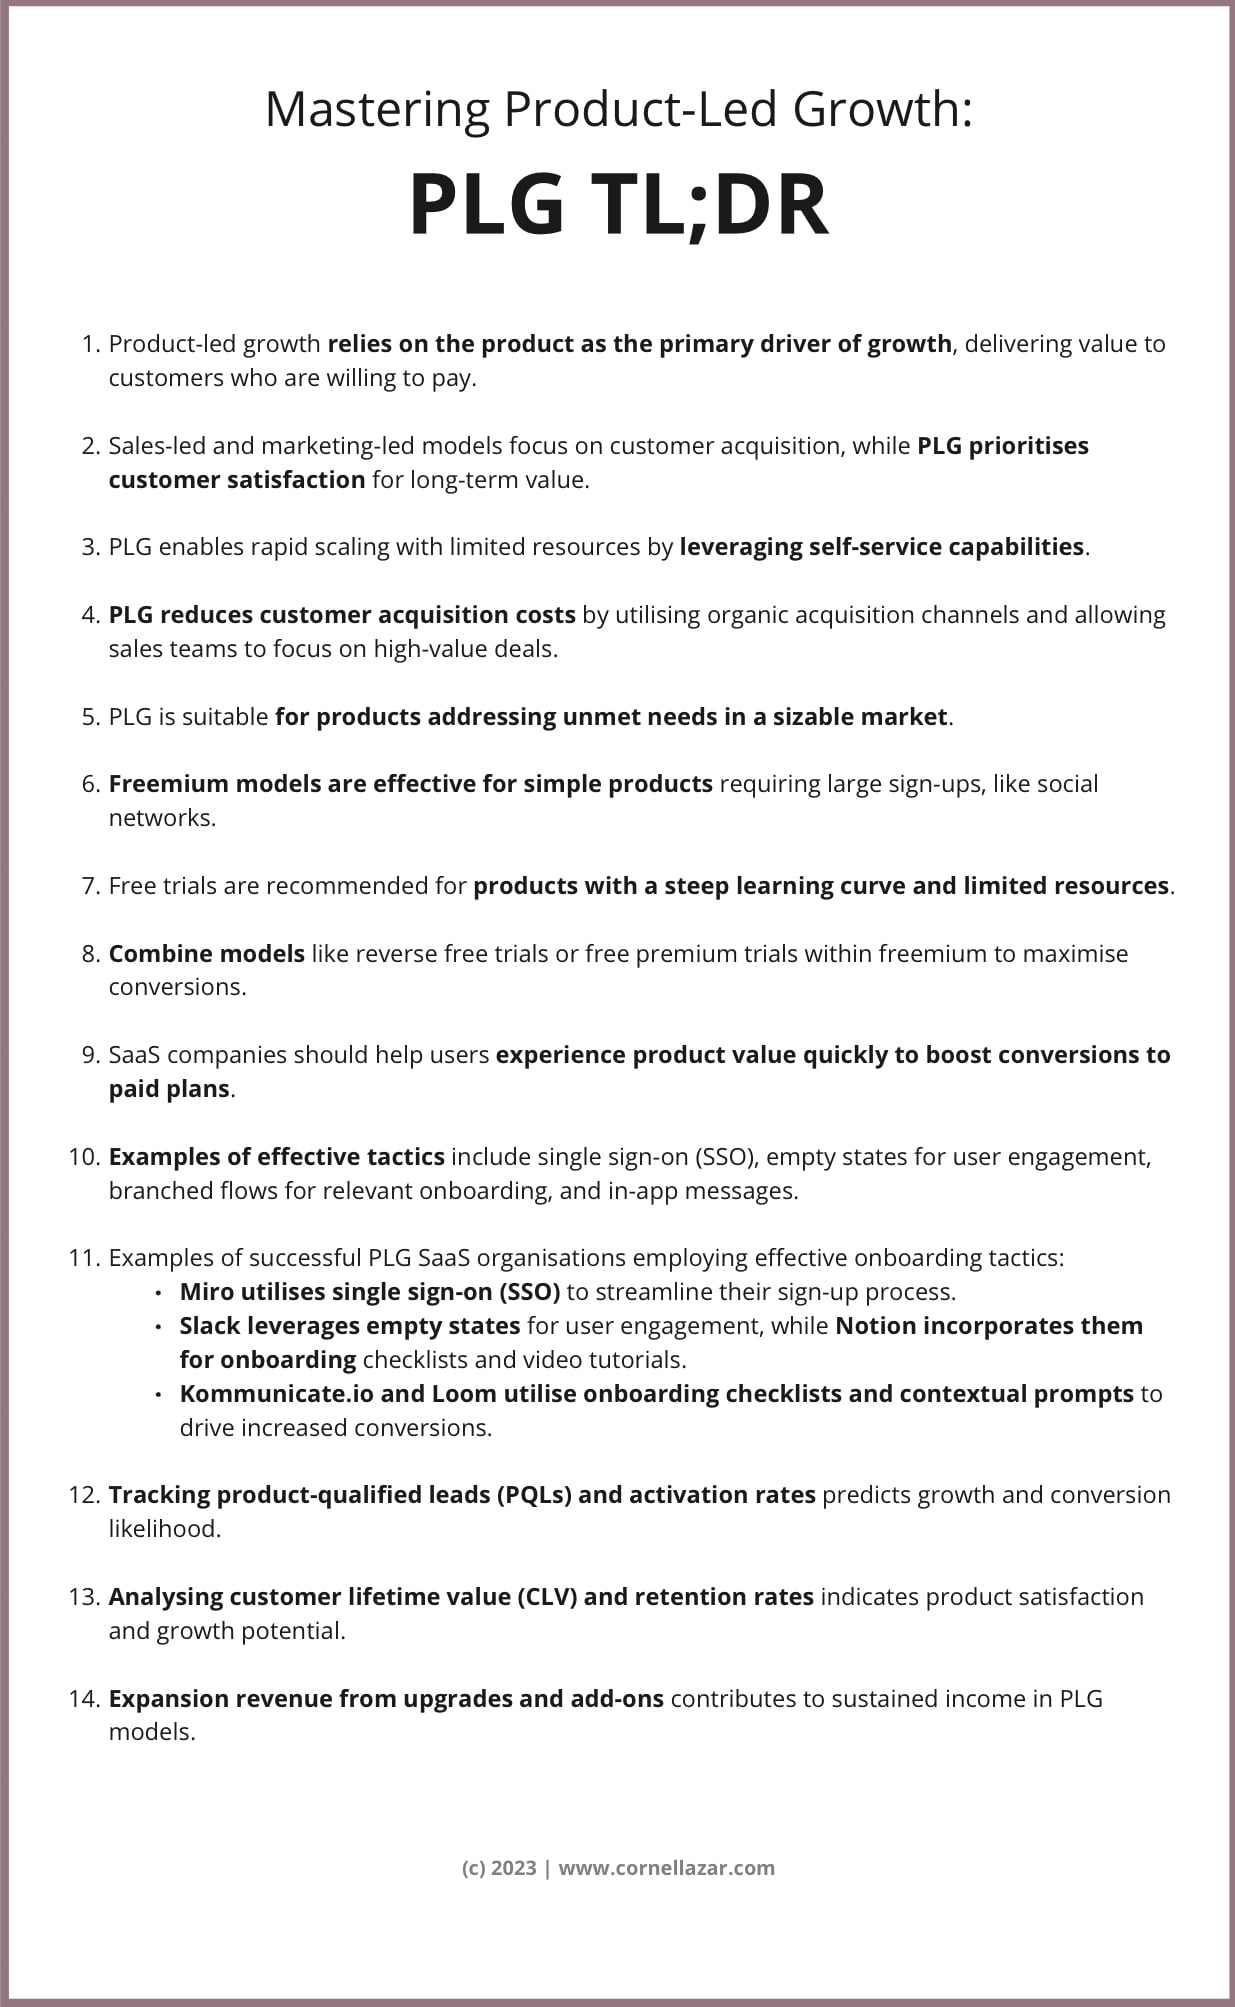
- Product-led growth relies on the product as the primary driver of growth, delivering value to customers who are willing to pay
- Sales-led and marketing-led models focus on customer acquisition, while PLG prioritises customer satisfaction for long-term value
- PLG enables rapid scaling with limited resources by leveraging self-service capabilities
- PLG reduces customer acquisition costs by utilising organic acquisition channels and allowing sales teams to focus on high-value deals
- PLG is suitable for products addressing unmet needs in a sizeable market
- Freemium models are effective for simple products requiring large sign-ups, like social networks
- Free trials are recommended for products with a steep learning curve and limited resources
- Combine models like reverse free trials or free premium trials within freemium to maximise conversions
- SaaS companies should help users experience product value quickly to boost conversions to paid plans
- Examples of effective tactics include single sign-on (SSO), empty states for user engagement, branched flows for relevant onboarding, and in-app messages
- Examples of successful SaaS companies employing effective product led growth onboarding tactics:
- Miro utilises single sign-on (SSO) to streamline their sign-up process
- Slack leverages empty states for user engagement, while Notion incorporates them for onboarding checklists and video tutorials
- Kommunicate.io and Loom utilise onboarding checklists and contextual prompts to drive increased conversions
- Miro utilises single sign-on (SSO) to streamline their sign-up process
- Tracking product-qualified leads (PQLs) and activation rates predicts growth and conversion likelihood
- Analysing customer lifetime value (CLV) and retention rates indicates product hub satisfaction and growth potential
- Expansion revenue from upgrades and add-ons contributes to sustained income in PLG models
Understanding Product-Led Growth
What is Product-Led Growth?
Product-led growth prioritises the product as the primary driver of customer acquisition, adoption, and expansion.
Instead of relying heavily on traditional sales and marketing techniques, product-led companies obsess on creating a seamless user experience and providing value through their product.
This approach allows users to explore and understand the product’s value proposition before committing to a purchase or subscription.
Benefits of a Product-Led Growth strategy
👉 Business benefits
PLG benefits for businesses can lead to faster and leaner customer acquisition, increased customer satisfaction, and higher conversion rates.
PLG products tend to offer free trials or freemium models, enabling users to try the product before committing financially.
👉 User benefits
For the user, PLG empowers the user and reduce fear of making an ill-informed purchase decision and buyer’s remorse.
This is achieved by offering and experience the product’s value upfront before making a financial commitment.
Getting to evaluate the product’s benefits and features firsthand, product-led-growth empowers users and reduces fear of a making wrong purchase decision. This can result in paving the way to a deeper level of trust and loyalty.
Measuring MRR for Product-Led Growth
What is Monthly Recurring Revenue (MRR)?
Monthly Recurring Revenue (MRR) is a key metric used to measure the predictable and recurring revenue generated by a subscription-based business. It represents the revenue that the company expects to receive on a monthly basis from its customers. MRR includes revenue from new subscriptions, upgrades, downgrades, and cancellations.
Importance of Measuring MRR
Measuring MRR is crucial for product-led businesses as it provides insights into the health and growth of the subscription revenue stream. It helps track the impact of customer acquisition, retention, and expansion efforts. By monitoring MRR, businesses can identify trends, spot growth opportunities, and make data-driven decisions.
Building a Product-Led Growth Model
Step 1: Define Your Customer Lifecycle
To build a product-led growth model, your customer lifecycle must be at the centre of it.
The customer lifecycle represents the stages a customer goes through; from initial awareness to becoming loyal advocates.
Typically, the customer lifecycle includes acquisition, activation, retention, and expansion.
By mapping out your customer lifecycle, you identify key product touchpoints and the actions they take at each stage. This sets you up for measuring and optimising the effectiveness of your product-led growth approach.
Step 2: Identify Key Metrics
The next step is to identify your KPIs that align with each stage. These metrics will provide insights into Growth performance of your initiatives and help track progress.
Some primary metrics to consider at each stage of the customer lifecycle include:
- Acquisition: Number of new sign-ups, conversion rates from free trial to paid subscription, cost of customer acquisition (CAC)
- Activation: Activation rate, time to first value, completion of onboarding tasks
- Retention: Churn rate, customer lifetime value (CLTV), net revenue retention (NRR)
- Expansion: Upsell and cross-sell revenue, expansion revenue as a percentage of total revenue
By monitoring these metrics, you are now enabled to identify conversion bottlenecks or fires and focus on areas that require optimisation within the lifecycle.
Step 3: Calculate Conversion Rates
Conversion rates (CVR) measure the percentage of users progressing from one stage (or touchpoint / event) in the customer lifecycle to the next over a specific period.
For example, to calculate the activation rate, divide the number of activated users by the total number of acquired users and multiply by 100.
Activation % = (# Activated Users) / (# Acquired Users)
By optimising conversion points across the user journey or experience journey, you increase the rate and numbers of users progressing through the customer lifecycle = Growth!
Step 4: Determine Average Revenue per User (ARPU)
ARPU, the Average Revenue per User over a specific period provides insights into the monetisation potential of your product and helps you understand the value your customers derive from it.
To calculate ARPU, divide the total revenue generated in a given period by the number of active users during that period.
ARPU = (Total Revenue) / (# Active Users)
Evaluate the effectiveness of your pricing strategy, identify opportunities for revenue growth, and benchmark performance against industry standards.
Step 5: Calculate MRR
MRR, or Monthly Recurring Revenue represents the predictable revenue from subscriptions by summing up monthly revenue generated from all active subscriptions.
Calculating MRR is business specific and there are nuances how a business will define their MRR in more granular detail,
The general formula is to multiply the number of active users by the average revenue per user (ARPU).
MRR = (# Active Users) * (ARPU)
Track and analyse MRR to help gauge the impact of customer acquisition, retention, and expansion efforts.
Visualising MRR Growth
MRR Growth Chart
Visualising MRR growth provide a clear and concise representation of the revenue trajectory over time and help identify trends, patterns, and anomalies in MRR growth.
In your growth model, you want to use a simple line chart to plot MRR on the y-axis against time on the x-axis.
Additionally, you can overlay other relevant data on the chart with your marketing campaigns, product updates, or pricing changes. This allows to adds an extra layer of insights and will improve your data storytelling when correlating trends to specific events or actions.
MRR Growth Dashboard
Everyone loves a good, actionable dashboard but not many know what it takes to build one. Getting this right will enable you to identify areas of improvement, monitor the impact of changes, and track progress towards your defined growth goals. An MRR growth dashboard may include:
- MRR growth chart
A visual representation of MRR growth over time (see 5.1 MRR Growth Chart). - Conversion rate metrics
Display conversion rates at each stage of the customer lifecycle, highlighting areas for improvement. - Churn and retention metrics
Tracking churn rate, customer retention, and engagement metrics to identify potential churn risks. - Revenue breakdown
Breaking down MRR by acquisition, expansion, and churn to understand the contribution of each component to overall growth. - Cohort analysis
Analysing MRR and retention rates for different cohorts of customers to understand the long-term impact of acquisition efforts. - Funnel visualisation
Mapping the user journey from acquisition to expansion, visualising conversion rates at each stage.
Leveraging MRR Data for Decision Making
Identifying Growth Opportunities
Analysing your MRR can help identifying growth opportunities, define hypotheses and prioritise initiatives with highest potential impact on revenue growth.
For example, if you observe a high conversion rate from acquisition to activation stage and a low conversion rate from activation to retention, you may find that you want to improve the onboarding process and increasing user engagement for driving higher retention rates.
Similarly, analysing patterns and behaviours of expansion revenue can reveal opportunities across product development, marketing and sales for increasing revenue from existing customers.
Analysing Churn and Retention
MRR data is a crucial KPI as part of tracking and analysing churn and retention rates.
Churn rate measures the percentage of customers who cancel their subscriptions within a given period.
Churn Rate = (# users at BP*) – (# users at EP*) / (# Users at BP*)
*BP = Beginning of Period | *EP = End of Period
Analysing retention metrics, such as customer lifetime value (CLTV) and net revenue retention (NRR), gives insights into profitability and growth potential of your customers.
A high CLTV indicates that customers are generating substantial revenue over their lifetime, while a positive NRR suggests that expansion revenue from existing customers is exceeding revenue lost from churned customers.
Identifying factors contributing to churn and implementing strategies to improve customer retention can significantly optimise your MRR and the wider PLG model.
Cohort Analysis & Performance Tracking
Cohort analysis involves grouping customers based on specific characteristics or time frames and analysing their behaviour and performance over time. By tracking cohort performance, you can gain insights into the long-term impact of acquisition efforts and understand how different cohorts contribute to MRR growth.
For example, create cohorts based on the month of acquisition and track their MRR growth over subsequent months. This can help identify cohorts exhibiting higher or lower MRR growth rates and determining factors contributing to it. Potential pointers may be marketing campaign effectiveness, product updates, or pricing changes.
Measuring customer retention within each cohort is another insight. Compare retention rates across different cohorts to identify trends and patterns.
Example: You notice a certain cohort has consistently high retention rates, you can analyse characteristics and behaviours to understand what drives loyalty for them and experiment with those insights across other cohorts.
Cohort analysis can also help assess product update / feature addition impacts. Track cohort performance before and after specific updates and determine their effectiveness in driving user engagement and revenue.
Conclusion
PLG models will help gain valuable insights into the health and progress of your business by giving access to the factors influencing the user experience end-to-end across acquisition and retention. Optimise product-led strategies, drive revenue and support building a successful and sustainable business.


